About
This is an application developed by the faculty and students in the Remote Sensing and GIS Lab from Louisiana State University. To shed light on community resilience to climate change, the app chooses hazards as climate change indicators to reveal how climate change affects our world, what the resilience of cities are in United States, and what kind of socio-economic patterns make cities more resilient.
The data we used including three parts:
(1). Hazards Data:it’s obtained from SHELDUS (Spatial Hazard Event and Losses Database for the US) database developed by the Hazards & Vulnerability and Research Institute at the University of South Carolina, including eighteen categories of natural hazard;
(2). Socio-economic Data: 25 variables were collected from US Census, which is consisted of social, demographic, economic, governmental and health variables.
(3). Geospatial Data: the county-level shapefile was downloaded from USGS.
The application has three major functions:
(1) County-level and state-level access to the incidences and damages caused by different natural hazards, and 25 socio-economic factors in the United States;
(2) Dynamically measure the community resilience levels in an interactive approach at the county level;
(3) Identify regional socio-economic variables affecting community resilience.
To dynamically measure community resilience, the resilience inference measurement (RIM) model (figure 1) is applied. The RIM model was first developed by Dr. Nina Lam (the proffessor and director of RSGIS lab) in Louisiana State University. The RIM model defines community resilience using three dimensions and two capabilities (figure 2).
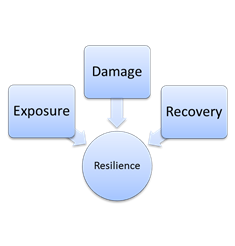
Fig. 1 Three dimensions of Resilience
| 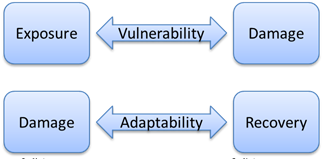
Fig 2 Two Capabilities of Resilience |
Based on different vulnerability and adaptability, communities are classified into four types (figure 3), susceptible, recovering, resistant and usurper from low to high resilience levels. A susceptible system is considered the least resilience system, as it has high vulnerability and low adaptability. A recovering system has about the same vulnerability and adaptability (closes to a straight line but can be above, near, or below the mean). A resistant system has low vulnerability and an average adaptability, whereas a usurper system has low vulnerability but very high adaptability
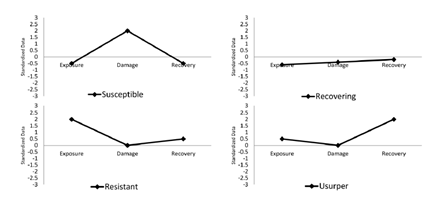
Fig 3 Four Types of Community Resilience
Assessment of community resilience by the RIM model is realized in three steps (figure 4):
(1) Based on the historical natural hazards records, classify counties in research areas into four defined resilience types;
(2) Based on the socioeconomic factors, verify the classification results in step (1)Via discriminant analysis, and select the discriminating variables which can best indicate communities’ resilience levels.
(3) Determine interactions between community resilience and selected indicators.
K-means and discriminant analysis are employed to complete the classification and discriminating procedures.
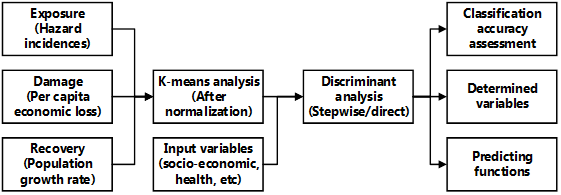
Fig 4 The Resilience Inference Measurement (RIM) model workflow
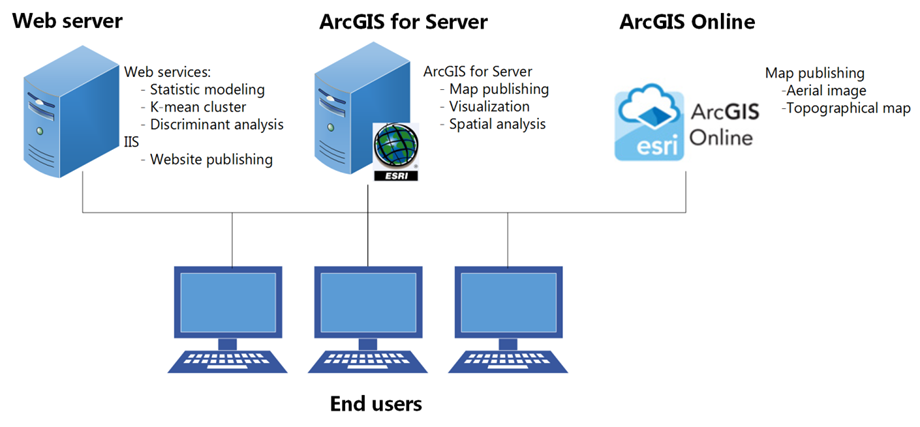 Fig.5 The architecture of the system. Disclaimer:
Your information will only be used to contact you regarding ICAMS software and its future version, and will not be distributed to any other party.
License Agreement:
The ICAMS software is for non-commercial i.e academic use ONLY. Use in a commercial setting IS STRICTLY PROHIBITED. You may NOT redistribute the software or part of the software in any form. You may NOT reverse engineer, decompile, modify, or disassemble (except to the extent applicable laws specifically prohibiting such restriction) the software.
The ICAMS software is provided on an "AS IS" basis. The provider (Dr. Nina Lam, LSU) does not provide any warranties, express or implied, including but not limited to the warranties of merchantability, fitness for a particular purpose and non-infringement. The provider does not warrant that the software meets your requirements or operates free from error.
Under no circumstances, shall the provider be liable to you or others for any direct or indirect, special, incidental, or consequential damages or losses arising out of the use or inability to use the software. The provider is not responsible for any actions or documents as a result of using the software.
Copyright © Dr. Nina Lam
2015.
|